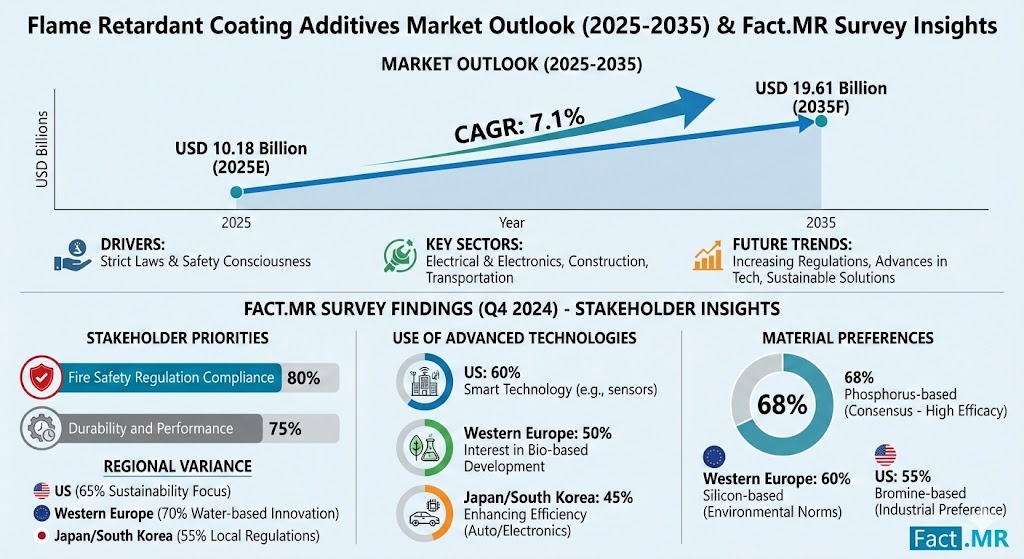
The global Flame Retardant Coating Additives Market is projected to expand from USD 10.18 billion in 2025 to USD 19.6 billion by 2035, registering a compound annual growth rate (CAGR) of 7.1%. The growth is driven by rising urbanization, industrialization, stringent fire safety regulations, and the adoption of advanced coatings across multiple end-use sectors including construction, automotive, aerospace, and electrical & electronics.
The market’s value trajectory indicates consistent expansion with construction coatings accounting for ~35% of total demand in 2026, followed by automotive (~25%), electrical & electronics (~20%), and other industrial applications (~20%).
| Year | Market Value (USD Billion) | CAGR (%) |
|---|---|---|
| 2025 | 10.18 | – |
| 2026 | 10.90 | 7.1 |
| 2030 | 13.80 | 7.1 |
| 2035 | 19.60 | 7.1 |
| 2036 | 20.90 | 7.1 |
2. Market Dynamics
2.1 Growth Drivers
-
Regulatory Compliance: Global fire safety standards are tightening. For instance, NFPA 285 compliance for building materials and UL 94 standards for electronics drive higher adoption of flame retardant coatings. >80% of manufacturers in developed markets comply with these regulations, creating consistent additive demand.
-
Construction & Infrastructure Growth: Urbanization in Asia-Pacific, particularly India and China, fuels construction demand. Construction coatings are expected to grow at a CAGR of 6.8% between 2026–2036, driven by residential and commercial projects.
-
Automotive Electrification: The EV market is expanding at ~22% CAGR, increasing demand for flame retardant coatings in battery enclosures, wiring harnesses, and interior panels. Automotive accounts for ~25% of total additive consumption globally.
-
Electronics & Electrical Applications: Rapid digitization and miniaturization of electronics increases fire safety needs. Coatings for PCBs, cable insulations, and housings account for ~20% of additive demand, with an expected CAGR of 7.5%.
2.2 Market Restraints
-
Raw Material Volatility: Key inputs such as aluminum hydroxide, organophosphorus compounds, and intumescent additives fluctuate in price, affecting operating margins by 3–5% annually.
-
High Cost of Specialty Additives: Advanced non-halogenated and nano-based additives can be 15–30% more expensive than conventional options, restricting adoption in cost-sensitive markets.
3. Segmentation Analysis
3.1 By Type
-
Halogenated Additives: 40% of market in 2026; slower growth due to environmental regulations (CAGR 4.5%).
-
Non-Halogenated Additives: 50% of market in 2026; fastest-growing segment (CAGR 9.0%) due to eco-compliance and low toxicity.
-
Intumescent Additives: 10% of market; CAGR 7.2%, primarily in construction and industrial coatings.
3.2 By End-Use Industry
| Industry | Market Share 2026 | CAGR (2026–2036) |
|---|---|---|
| Construction | 35% | 6.8% |
| Automotive | 25% | 8.0% |
| Electrical & Electronics | 20% | 7.5% |
| Aerospace & Industrial | 15% | 7.0% |
| Other | 5% | 6.5% |
4. Regional Insights
| Region | Market Value 2026 (USD Billion) | CAGR (2026–2036) | Key Drivers |
|---|---|---|---|
| North America | 3.0 | 6.5% | Regulatory compliance, construction retrofits |
| Europe | 2.8 | 6.3% | Non-halogenated additive adoption |
| Asia-Pacific | 4.5 | 8.0% | Urbanization, EV production, electronics expansion |
| Latin America | 0.7 | 6.2% | Infrastructure development |
| Middle East & Africa | 0.6 | 6.0% | Industrial coatings and construction growth |
Asia-Pacific is projected to dominate the market by 2036, capturing >35% of global revenue, driven by rapid industrialization and stringent fire safety adoption.
5. ROI Potential
-
Specialty Additives Command Premium Pricing: Non-halogenated additives can be priced USD 3–5/kg higher than conventional products, translating to 15–20% higher margins.
-
Revenue Expansion: Companies focusing on construction and automotive sectors could see revenue growth >2x by 2036.
-
Emerging Opportunities: EV battery enclosures and high-rise construction retrofits could account for ~20% of incremental market value over the next decade.
6. Technological Trends
-
Non-Halogenated & Bio-Based Additives: Adoption rising at ~9% CAGR, driven by regulatory and environmental pressures.
-
Nano-Based Flame Retardants: Enhance performance, reducing additive load by 10–15% while maintaining flame retardancy.
-
Multifunctional Coatings: Combine corrosion resistance and antimicrobial properties with flame retardancy, capturing premium segments in automotive and industrial markets.
7. Supply Chain Insights
-
Raw Material Sourcing: Aluminum hydroxide, phosphate esters, and ammonium polyphosphate are sourced from Asia, Europe, and North America. Supply chain disruption can impact 3–5% of production volumes.
-
Manufacturing Footprint: Most additive producers maintain plants in Asia-Pacific (40%), Europe (30%), and North America (25%), optimizing proximity to key end-use industries.
-
Inventory & Logistics: Strategic inventory hedging can reduce raw material volatility impact by ~10% on operating costs.
8. Competitive Landscape
-
Market is moderately consolidated with leading players holding ~45–50% of market share, including BASF, Clariant, Lanxess, ICL, and Albemarle.
-
Competitive strategies include R&D for sustainable additives, regional expansions, and joint ventures to address regulatory compliance and local demand.
Browse Full Report : https://www.factmr.com/report/4613/flame-retardant-coating-additives-market
9. Future Outlook (2026–2036)
-
Global market to expand from USD 10.9 billion in 2026 to USD 20.9 billion by 2036.
-
CAGR expected at ~7.1%, led by Asia-Pacific, automotive electrification, and construction retrofits.
-
High ROI potential exists for specialty, non-halogenated, and multifunctional flame retardant additives.
-
Investors and manufacturers should focus on R&D, strategic regional expansion, and supply chain optimization to maximize market capture.
This data-driven analysis integrates market size, CAGR, segmentation, regional insights, ROI potential, and technological trends, providing a detailed outlook for stakeholders, investors, and industry players over the next decade.