The U.S. market for automated guided carts (AGCs) — compact, driverless material-handling vehicles optimized for low- to mid-range payloads — is poised for rapid expansion as manufacturers, automotive plants, logistics centres, and e-commerce fulfilment operations pursue higher throughput, lower labour dependency, and safer shop-floor environments. AGCs deliver flexible, low-cost automation for repetitive intra-site transport tasks and are increasingly used alongside conveyors, automated guided vehicles (AGVs), and AMRs to form hybrid material-flow ecosystems.
Advances in navigation (QR/vision), battery technology, ease of integration, and a shortening ROI horizon for tight-turnaround facilities are driving fleet rollouts across both established industrial segments (automotive, electronics) and fast-growing areas (e-commerce, cold logistics). Adoption is strongest where floor space is limited, throughput is moderate, and rapid redeployment of automation assets is valued.
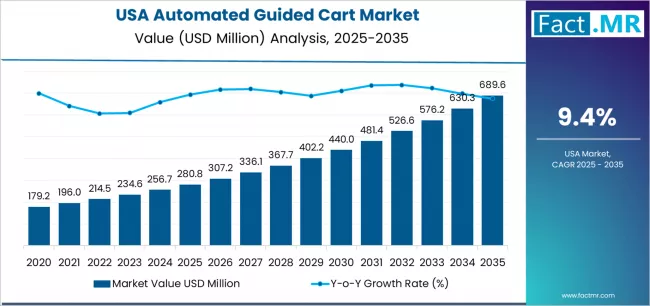
Quick Stats (2025–2035)
-
2025 Market Value (USA): USD 280.8 million.
-
2035 Forecast Market Value (USA): USD 689.6 million.
-
Absolute Growth (2025–2035): ≈ USD 414.8 million.
-
Forecast CAGR (2025–2035): ~9.4%.
-
Leading Navigation Tech (2025): QR/Vision — ~48.2% share.
-
Top End-Use (2025): Automotive sector — ~41.3% share.
To access the complete data tables and in-depth insights, request a Discount On The Report here: https://www.factmr.com/connectus/sample?flag=S&rep_id=12296
Key Market Drivers
1. Need for Flexible, Low-Cost Automation
-
AGCs provide targeted automation without the footprint or capital of fixed conveyors or heavy AGVs.
-
Quick redeployment and plug-and-play integration suit seasonal facilities and contract manufacturers.
2. Proliferation of QR/Vision Navigation
-
QR/vision navigation systems reduce infrastructure changes (no floor wiring or magnetic tape) and speed installation.
-
Accuracy and obstacle handling improvements make AGCs safe for mixed human/robot environments.
3. Automotive & Tier-1 Manufacturing Demand
-
High repeatability, part-feeding, and in-plant logistics needs in automotive plants drive significant AGC adoption.
-
AGCs are used in sequenced part delivery, kitting, and just-in-time workflows.
4. E-commerce & Light-Manufacturing Growth
-
Last-mile fulfilment within big warehouses and micro-fulfilment centres uses AGCs for sortation, replenishment, and returns handling.
-
SMEs adopt AGCs to automate without committing to large, fixed automation projects.
5. Lower Total Cost of Ownership (TCO)
-
Improvements in battery life, modular charging, and remote diagnostics reduce downtime and operating expense versus older vehicles.
Market Structure & Segment Insights
By Navigation Technology
-
QR/Vision (dominant): Best balance of cost, flexibility, and accuracy.
-
Laser/SLAM: Favoured where mapping and dynamic rerouting are priorities.
-
Magnetic/Inductive: Legacy sites and heavy-duty payloads still employ these proven systems.
By Payload Class
-
≤500 kg (most common): Optimal for material reels, kitted parts, and small totes.
-
500–1000 kg: Used in heavier kitting and short-haul pallet movements.
-
>1000 kg: Niche for industrial floor transport where AGVs traditionally dominated.
By End-User
-
Automotive & Tier-1 Suppliers (largest): High reuse value for in-plant logistics.
-
Electronics & Medical Devices: Precision, cleanliness, and flexibility requirements promote AGC uptake.
-
E-commerce & Retail Fulfilment: Small payload agility and dense SKU environments favour AGCs.
-
Food & Cold Chain: Battery and hygiene improvements increasingly make AGCs viable here.
Regional Dynamics (within the USA)
-
Highest adoption in the Midwest (automotive clusters), Southeast (manufacturing & fulfilment growth), and West Coast (tech and e-commerce hubs).
-
Growth corridors follow logistics investment, reshoring of manufacturing, and rise of micro-fulfilment facilities in urban markets.
Challenges & Constraints
-
Integration Complexity: Legacy systems integration, safety fencing changes, and IT interoperability can slow rollouts.
-
Skilled Workforce Needs: Technicians for fleet management and system tuning are in demand.
-
Capital Planning: While TCO is attractive, initial procurement and pilot costs remain a hurdle for some SMEs.
-
Standardization: Varying vendor protocols complicate multi-vendor fleet orchestration.
Opportunities & Strategic Moves
-
Fleet as a Service (FaaS): Rental/managed fleets lower entry barriers and accelerate adoption for small users.
-
Hybrid Solutions: Combine AGCs with fixed conveyors and AMRs for optimized material flows.
-
Software & Orchestration: Vendors offering cloud-based fleet management, predictive maintenance, and analytics create recurring revenue streams.
-
Payload & Application Innovation: Design AGCs for specialized tasks (tote picking, cold storage) to enter new verticals.
Outlook
With projected growth from USD 280.8 million in 2025 to USD 689.6 million by 2035 and a ~9.4% CAGR, the U.S. automated guided cart market will more than double by 2035. Adoption will accelerate where flexible navigation (QR/vision), attractive TCO, and the need for quick redeployable automation intersect — notably in automotive, e-commerce, and light manufacturing. Suppliers that pair reliable hardware with strong software orchestration, managed services, and verticalized solutions will capture the largest share of this expanding market.
Browse Full Report: https://www.factmr.com/report/united-states-automated-guided-cart-market